

Appearance
Value and Risk
The Value and Risk view compares the annual economic value of each AI System with its risk value. Modulos then gives each AI System one assessment: Positive, Inconclusive, Negative, or Incomplete data.
What this is
A risk value shows only one side of a decision. An AI System with a high risk value can be a good investment when its economic value is much higher. An AI System with a low risk value can be a bad investment when its economic value is lower than that risk value.
The Value and Risk view shows the two sides together. Use it to answer these questions:
- Which AI Systems give more value than risk?
- Which AI Systems have a risk that is larger than their value?
- Which AI Systems do not have sufficient data for a decision?
- What is the net value of the AI Systems that have complete data?
Where in Modulos
- Go to
Organization → Risk Management → Portfolio. - Select Value and Risk.
The Treemap and Value and Risk buttons are at the top of the Portfolio tab. They show on the first level of the tab only, not after you select a group, an AI System, or a risk category. Treemap is the map of risk values against risk limits. See Treemap.
Who sees what
The view includes the AI Systems with the registration status Pending or Approved that you have access to. The totals, the lists, the table, and the export include only these AI Systems. For the rules, see The Portfolio tab.
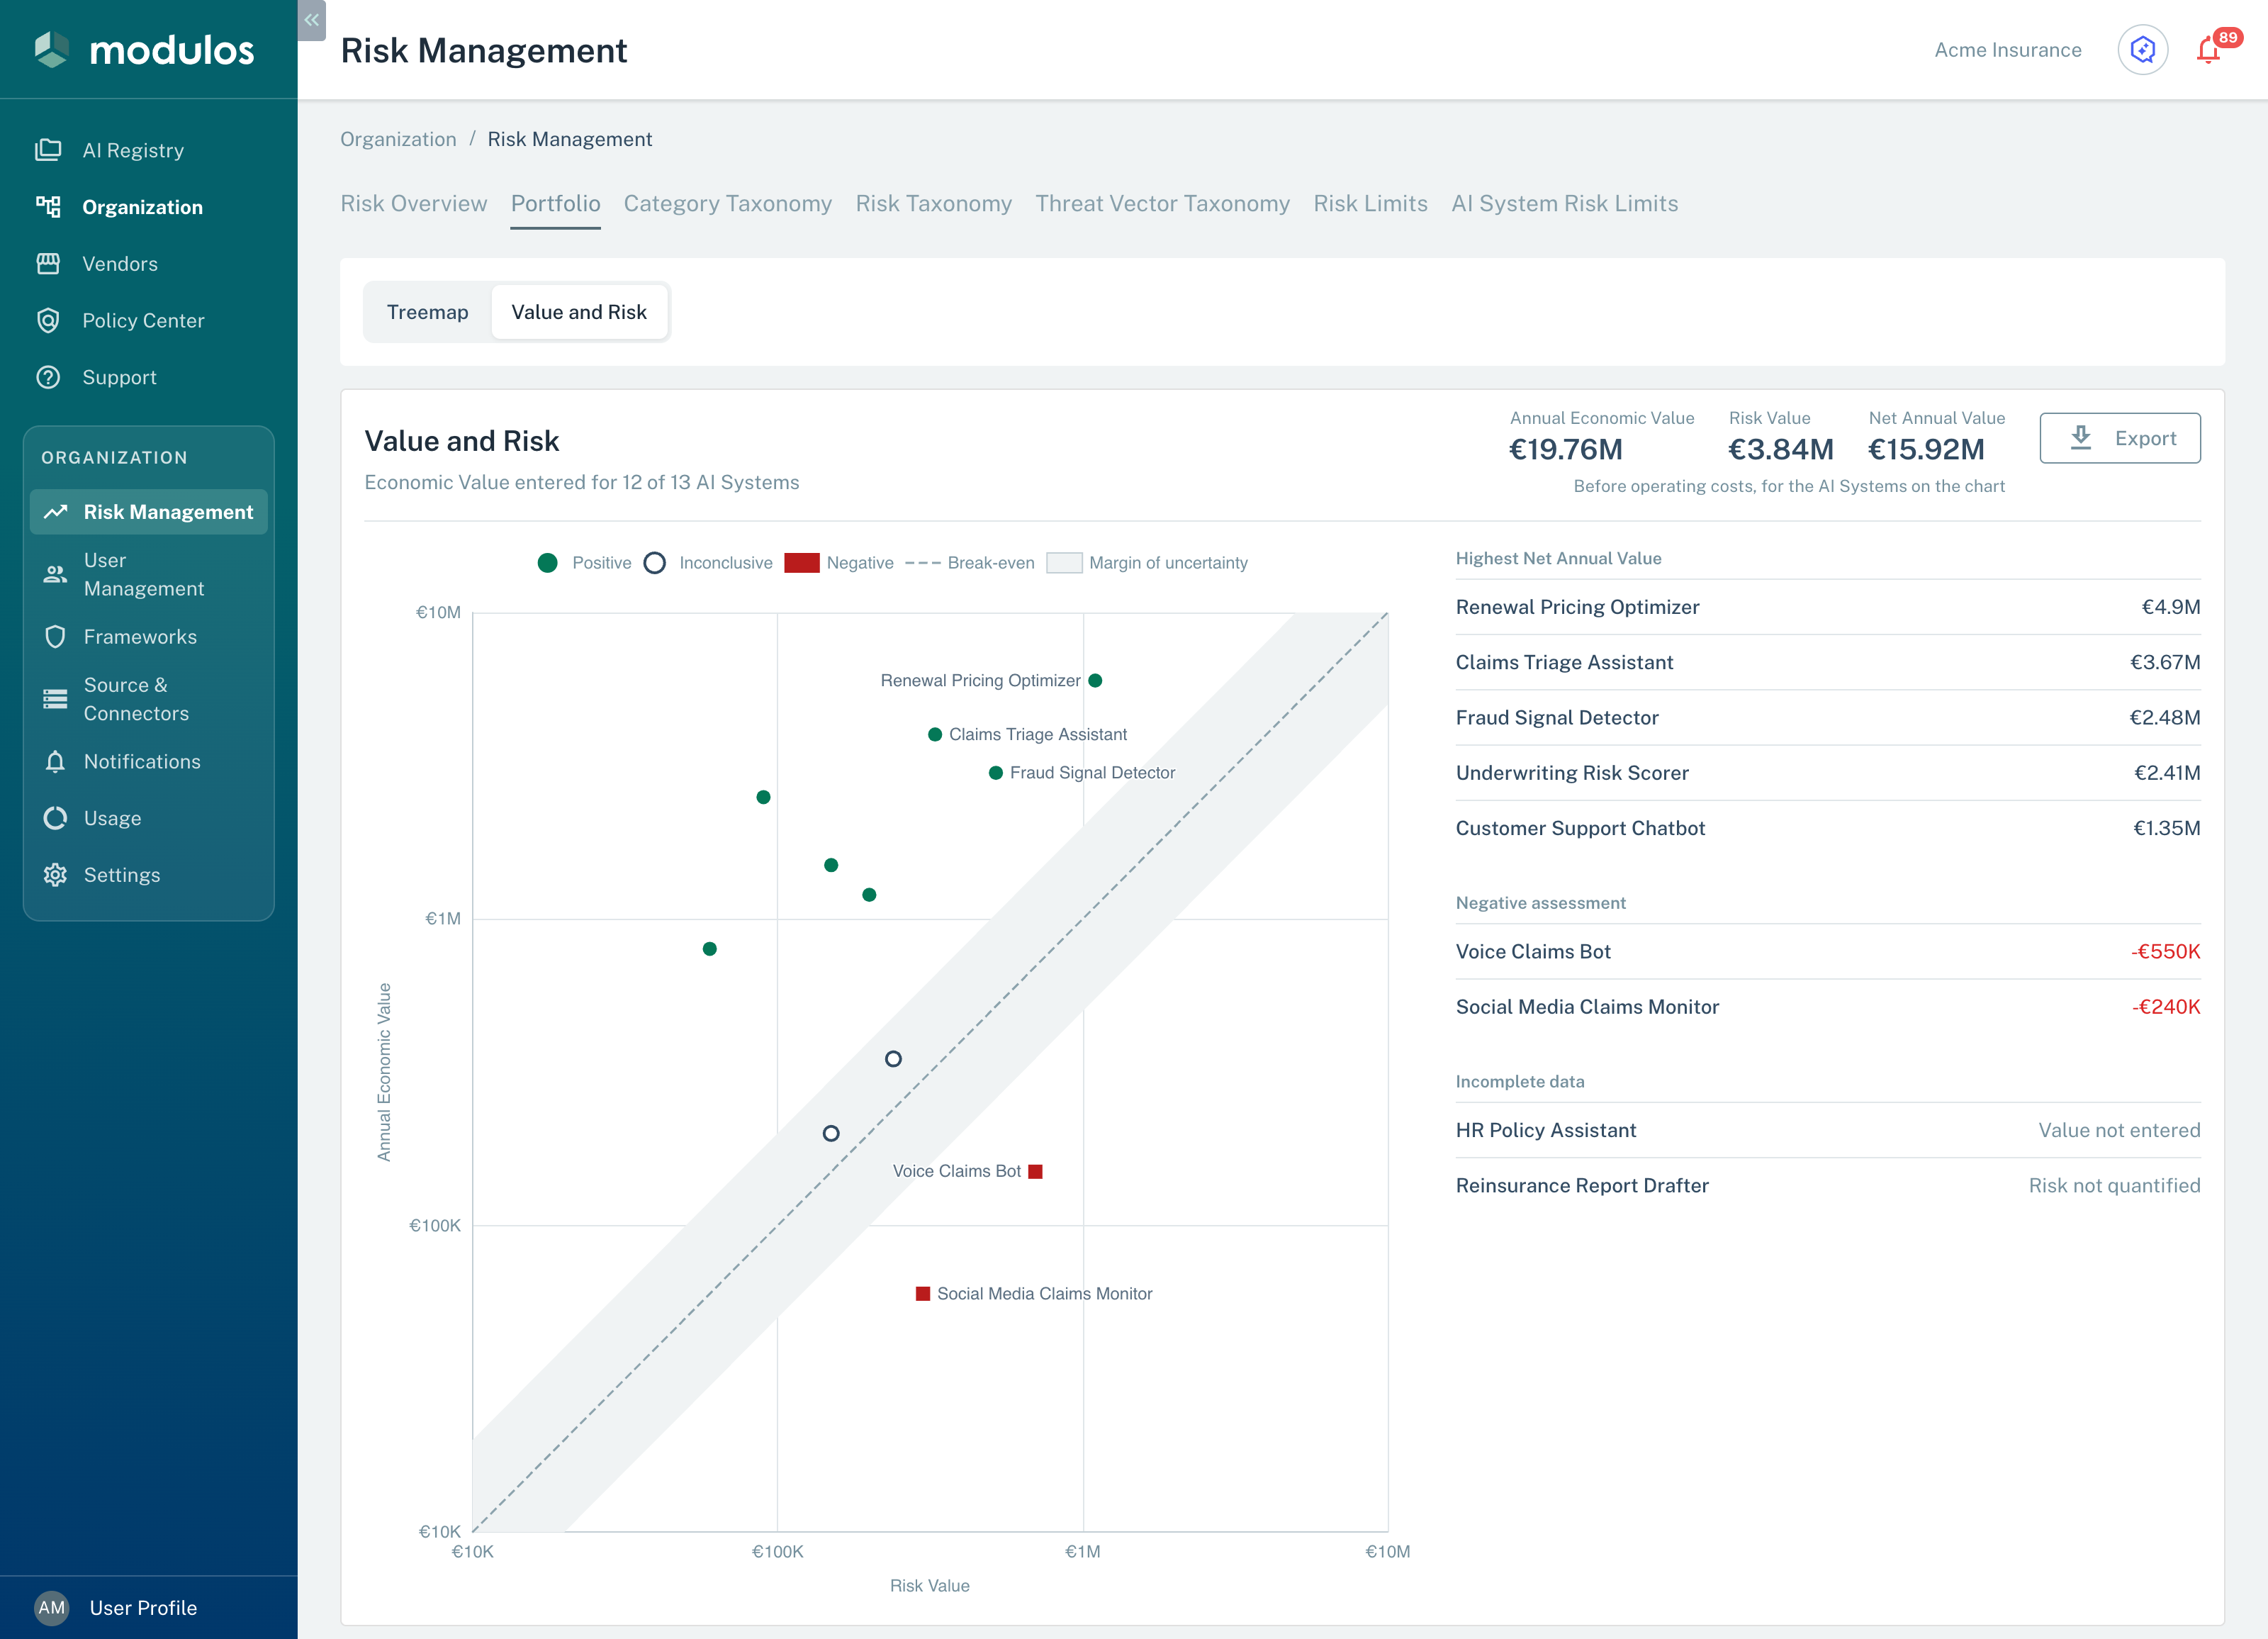
- 1Value and RiskChanges from the Treemap view to the Value and Risk view.
- 2Net Annual ValueThe Annual Economic Value minus the Risk Value, for the AI Systems on the chart.
- 3Break-evenOn the dashed line, the two values are equal. In the band around the line, the assessment is Inconclusive.
- 4Negative assessmentThe AI Systems with an economic value of less than half of their risk value.
- 5Incomplete dataThe AI Systems that are not on the chart, each with the value that is missing.
Economic value, risk value, and net value
The values in the view are in the currency of the organization. The Annual Economic Value is for one year. Modulos reads the Risk Value as a loss for one year. Thus use a time basis of one year when you quantify a threat vector.
| Value | What it is | Where it comes from |
|---|---|---|
| Annual Economic Value | The value that the AI System gives in one year. Examples are more revenue, lower costs, and losses that it prevents. | A person enters it. See Enter the economic value. |
| Risk Value | The expected loss from the AI System: the sum of the values of its quantified threat vectors. | Risk Quantification |
| Net Annual Value | The Annual Economic Value minus the Risk Value. | Modulos calculates it. |
All values are before operating costs. Modulos does not subtract the cost to operate the AI System.
A threat vector is quantified when its newest run has the status Quantified. When only some threat vectors of an AI System are quantified, the Risk Value includes only those. For the full rules, see How risk becomes a portfolio signal.
The assessment
Modulos compares the Annual Economic Value of each AI System with its Risk Value:
| Assessment | Rule |
|---|---|
| Positive | The Annual Economic Value is two times the Risk Value or more. |
| Inconclusive | The Annual Economic Value is less than two times the Risk Value, and not less than half of the Risk Value. |
| Negative | The Annual Economic Value is less than half of the Risk Value. |
| Incomplete data | The AI System has no Annual Economic Value, or it has no quantified threat vector. |
The two values are equal at Break-even. Each value is an estimate. Thus Modulos puts a Margin of uncertainty of a factor of two on each side of break-even. An AI System in this margin is Inconclusive, also when its Net Annual Value is above or below zero.
For example, an AI System has an Annual Economic Value of 1,000,000:
- With a Risk Value of 500,000 or less, the assessment is Positive.
- With a Risk Value of more than 500,000 and not more than 2,000,000, the assessment is Inconclusive.
- With a Risk Value of more than 2,000,000, the assessment is Negative.
These rules also apply:
- An Annual Economic Value of 0 is the same as no value.
- An AI System with an Annual Economic Value and a quantified Risk Value of 0 is Positive.
- The assessment can change when you quantify more threat vectors, because the Risk Value then includes more values.
How to read the view
Header
The header shows the line Economic Value entered for n of m AI Systems and the totals Annual Economic Value, Risk Value, and Net Annual Value. The totals include only the AI Systems on the chart. A Net Annual Value below zero shows in red.
Chart
The chart shows one point for each AI System that has an Annual Economic Value and one or more quantified threat vectors. AI Systems with Incomplete data are not on the chart.
- The Risk Value is on the horizontal axis and the Annual Economic Value is on the vertical axis. The two axes have the same logarithmic scale.
- The dashed Break-even line goes from the bottom left to the top right. The band around the line is the Margin of uncertainty.
- A point above the band is Positive. A point in the band is Inconclusive. A point below the band is Negative. The legend shows the symbol of each assessment.
- The chart shows the names of the AI Systems with a Negative assessment and of the three AI Systems with the largest Annual Economic Value. If two names overlap, the chart shows only one of them.
- Put the pointer on a point to see the name of the AI System, its values, and its assessment. If only some threat vectors are quantified, you also see Threat Vectors quantified, for example 3 of 8.
Lists
These lists are next to the chart:
- Highest Net Annual Value: the five AI Systems with the highest Net Annual Value.
- Negative assessment: the AI Systems with a Negative assessment. The AI System with the lowest Net Annual Value is first.
- Incomplete data: the AI Systems that are not on the chart. Each one shows what is missing: Value not entered or Risk not quantified. If the two values are missing, it shows Value not entered.
If more than five AI Systems have a Negative assessment, the view shows Show all n in the table and not their names. Select it to see these AI Systems in the table. The same rule applies to the AI Systems with Incomplete data.
Table
The table below the chart shows each AI System of the view with these columns: AI System, Annual Economic Value, Risk Value, Net Annual Value, and Assessment.
- At first, the AI System with the highest Net Annual Value is first. The AI Systems with Incomplete data are last.
- Select a column heading to sort by that column. The Assessment column sorts by the Annual Economic Value divided by the Risk Value.
- Use the search field to find an AI System by its name.
- Select Filter, then Assessment, to see only the AI Systems with the assessments that you select.
If a value is missing, its cell shows Value not entered or Risk not quantified, and the AI System has no Net Annual Value.
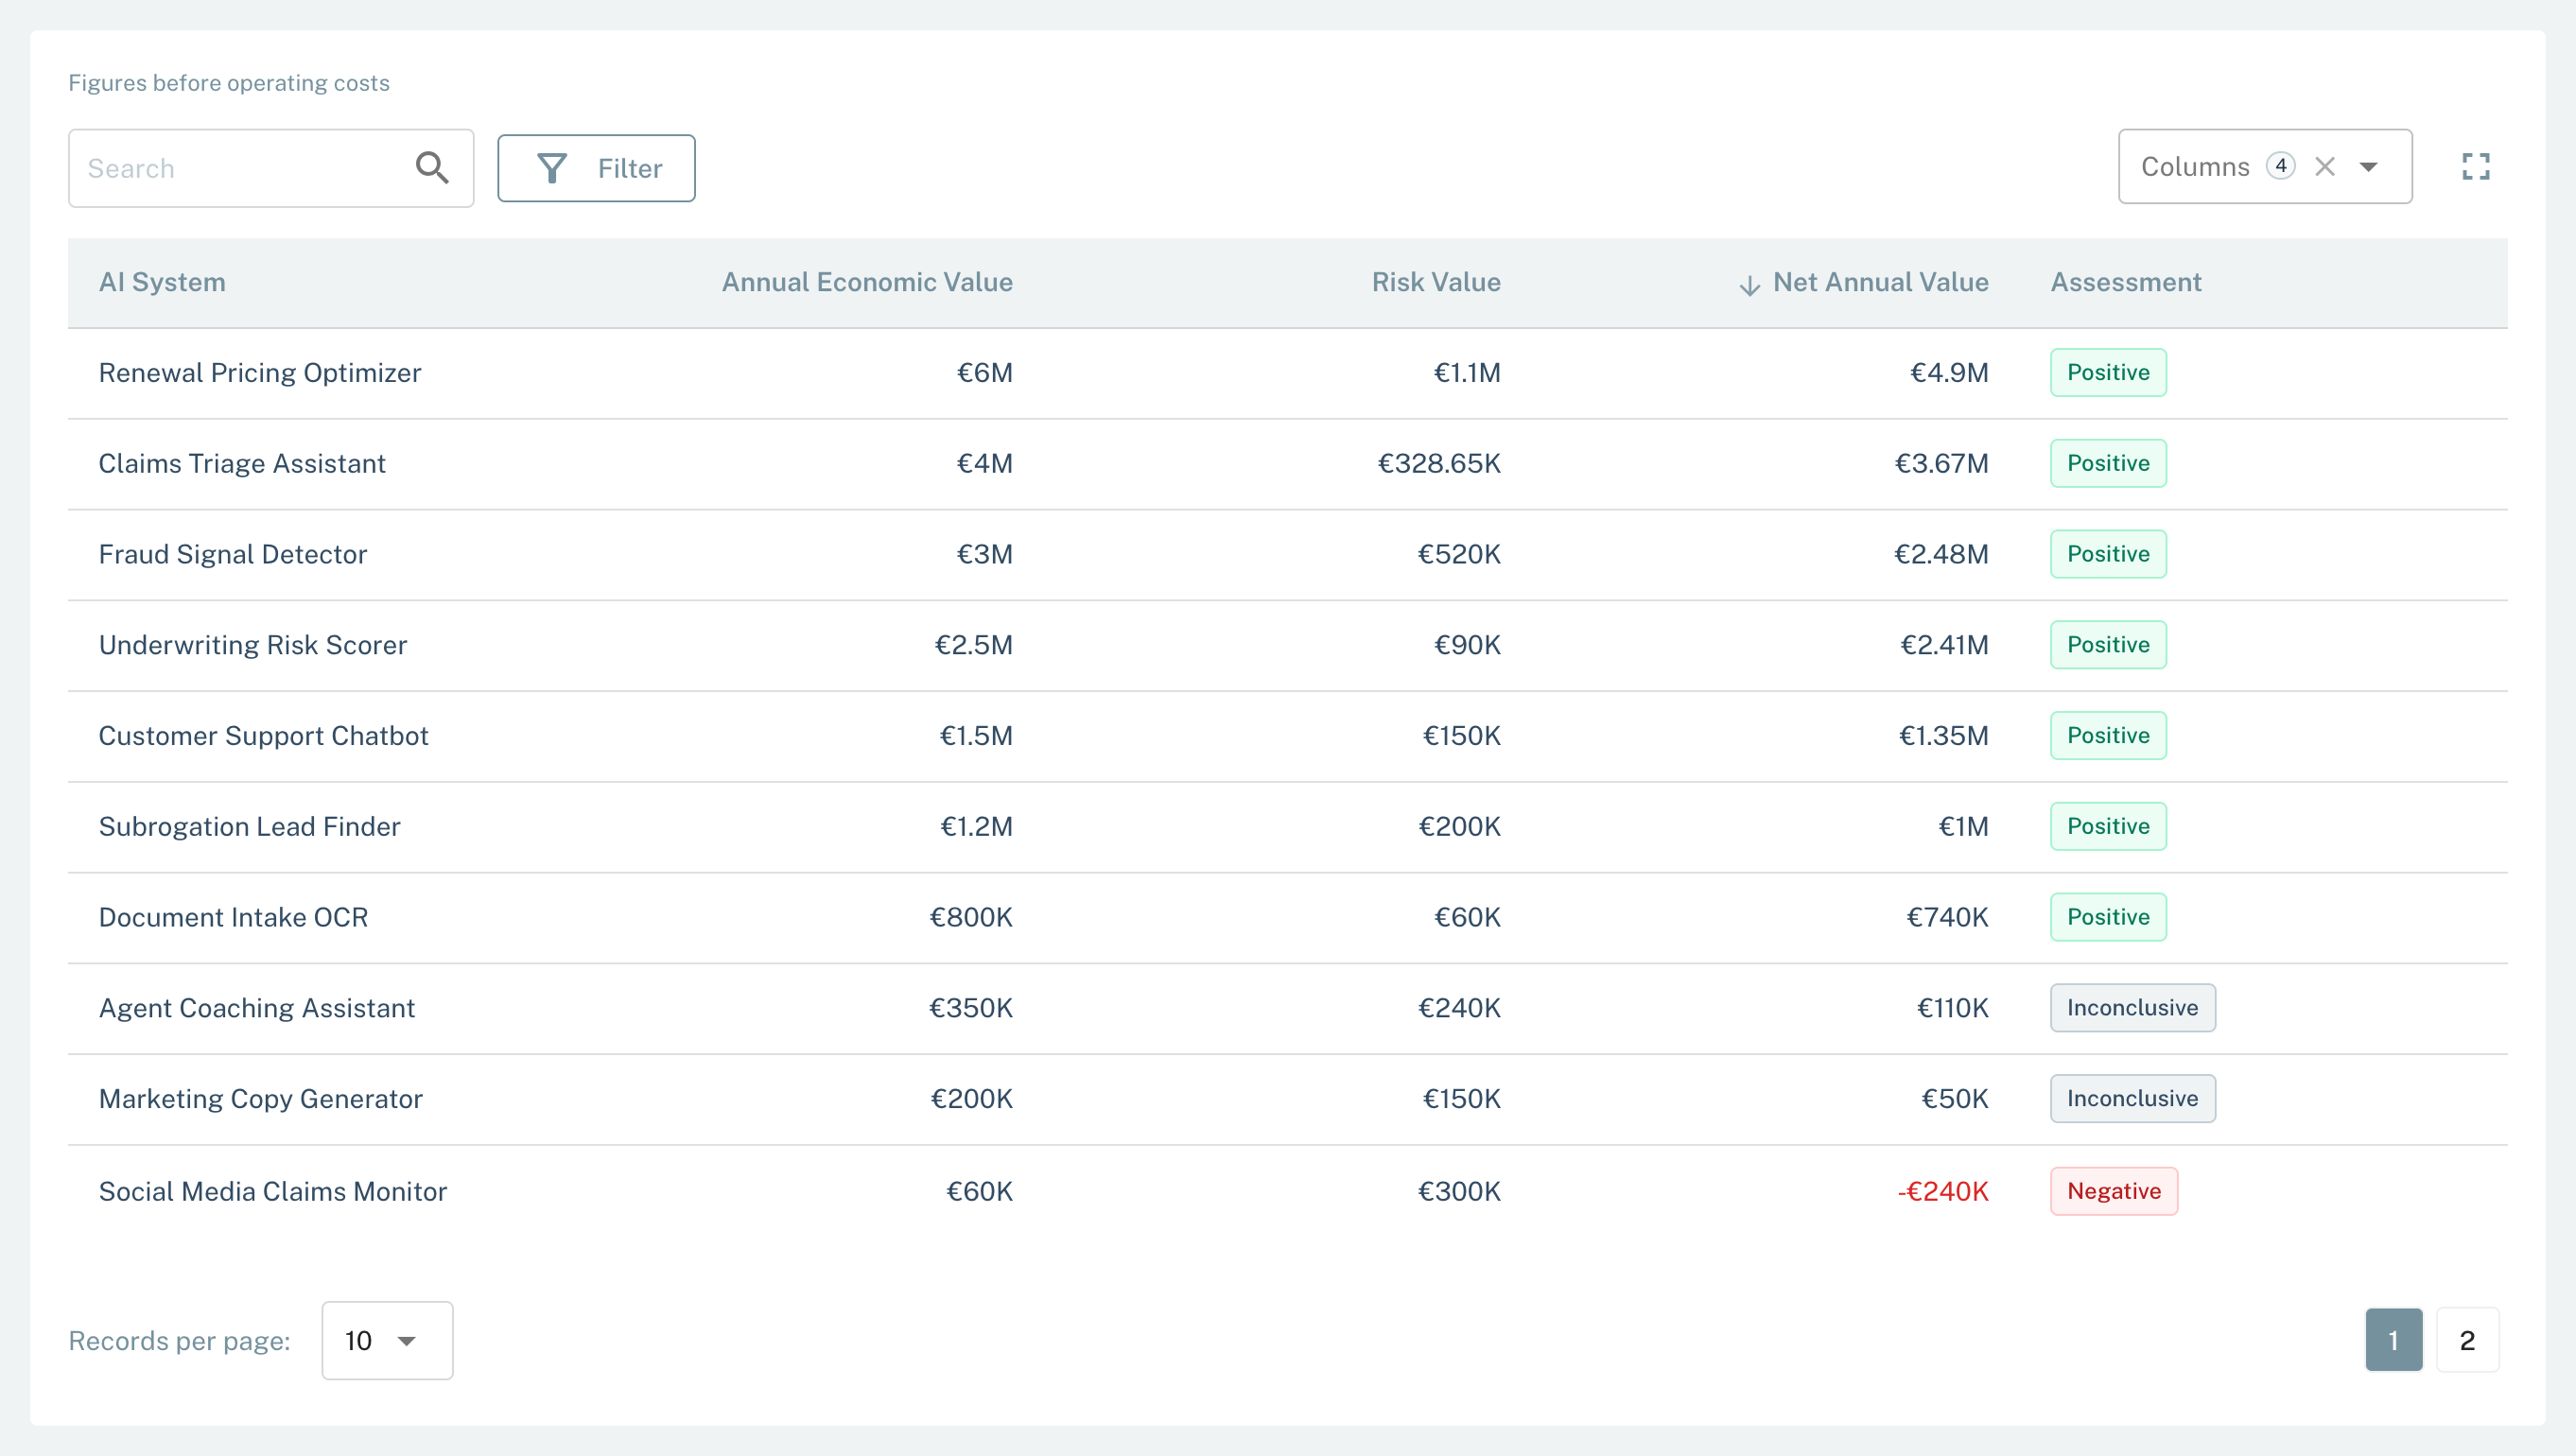
- 1FilterHas the Assessment filter.
- 2Net Annual ValueThe first sort order. The AI Systems with Incomplete data are last.
- 3AssessmentPositive, Inconclusive, Negative, or Incomplete data.
The view does not open an AI System. To see the risks and the threat vectors of an AI System, go to AI System → Risks. You can also select Treemap and go down to the AI System.
Export the data
Select Export in the header to download the data as a CSV file.
The file has one row for each AI System of the view, also when the table has a filter. The columns are the AI System, the Annual Economic Value, the Risk Value, the Net Annual Value before operating costs, and the Assessment. The headings of the value columns include the currency code of the organization, for example EUR. A missing value is an empty cell, not a zero.
Put an AI System on the chart
An AI System is on the chart when it has an Annual Economic Value and one or more quantified threat vectors.
Enter the economic value
AI System Owners and users with full access to all AI Systems can enter the value.
- Go to
AI System → Settings → General Settings. - In the Risk Management card, enter the AI System Annual Economic Value.
- Select Save Changes.
You can also enter the value in the registration wizard, or with Edit on the Organization → Risk Management → AI System Risk Limits tab.
Estimate the value that the AI System gives, or will give, in one year. A first estimate is sufficient, and you can change it when you know more. The value is 0, or a number from 0.01 to 10,000,000,000,000.
Quantify the risk
- Go to
AI System → Risks. - Add the risks that apply to the AI System. See AI System Risks.
- Quantify one or more threat vectors. See How to run quantification.
What to do with each assessment
| Assessment | What to do |
|---|---|
| Positive | Quantify again when the system, its data, its vendors, or its Controls change. |
| Inconclusive | Make the two estimates better. Quantify the threat vectors that have no value, and examine the economic value with the owner of the AI System. |
| Negative | Decrease the risk through Controls and quantify again. If the assessment stays Negative, make a decision: continue, change the scope, or stop the AI System. See Acting on Quantified Risk. |
| Incomplete data | Enter the economic value, or quantify one or more threat vectors. |
Limits of the view
- The view does not include the cost to operate an AI System.
- The view does not use the risk limits. The Treemap view compares the risk values with the limits.
- A threat vector without a quantified value adds nothing to the Risk Value. Thus an AI System with only some quantified threat vectors can have a better assessment than its full risk gives. Examine Threat Vectors quantified before you make a decision.
Related pages
Treemap
The other view of the Portfolio tab: a map of the risk values against the risk limits
Risk Quantification
Get monetary values and make your estimates better from run to run
Acting on Quantified Risk
Compare values with limits, decrease risk through Controls, and quantify again
AI System Settings
The Risk Management card with the annual economic value and the risk limit