

Appearance
Treemap
The Treemap view shows the risk values of the organization as a map of tiles, and compares each value with its risk limit. Use it to find the groups, the AI Systems, and the risks that use the most of their limits.
Where in Modulos
- Go to
Organization → Risk Management → Portfolio. - Select Treemap.
The Portfolio tab opens in the Treemap view. The Treemap and Value and Risk buttons are at the top of the tab. Value and Risk compares the annual economic value of each AI System with its risk value. See Value and Risk.
Who sees what
The map shows only AI Systems with the status Pending or Approved, and only those that you have access to. If you do not have full access to all AI Systems, the limit of the organization is the sum of the limits of the AI Systems that you see. For the rules, see The Portfolio tab.
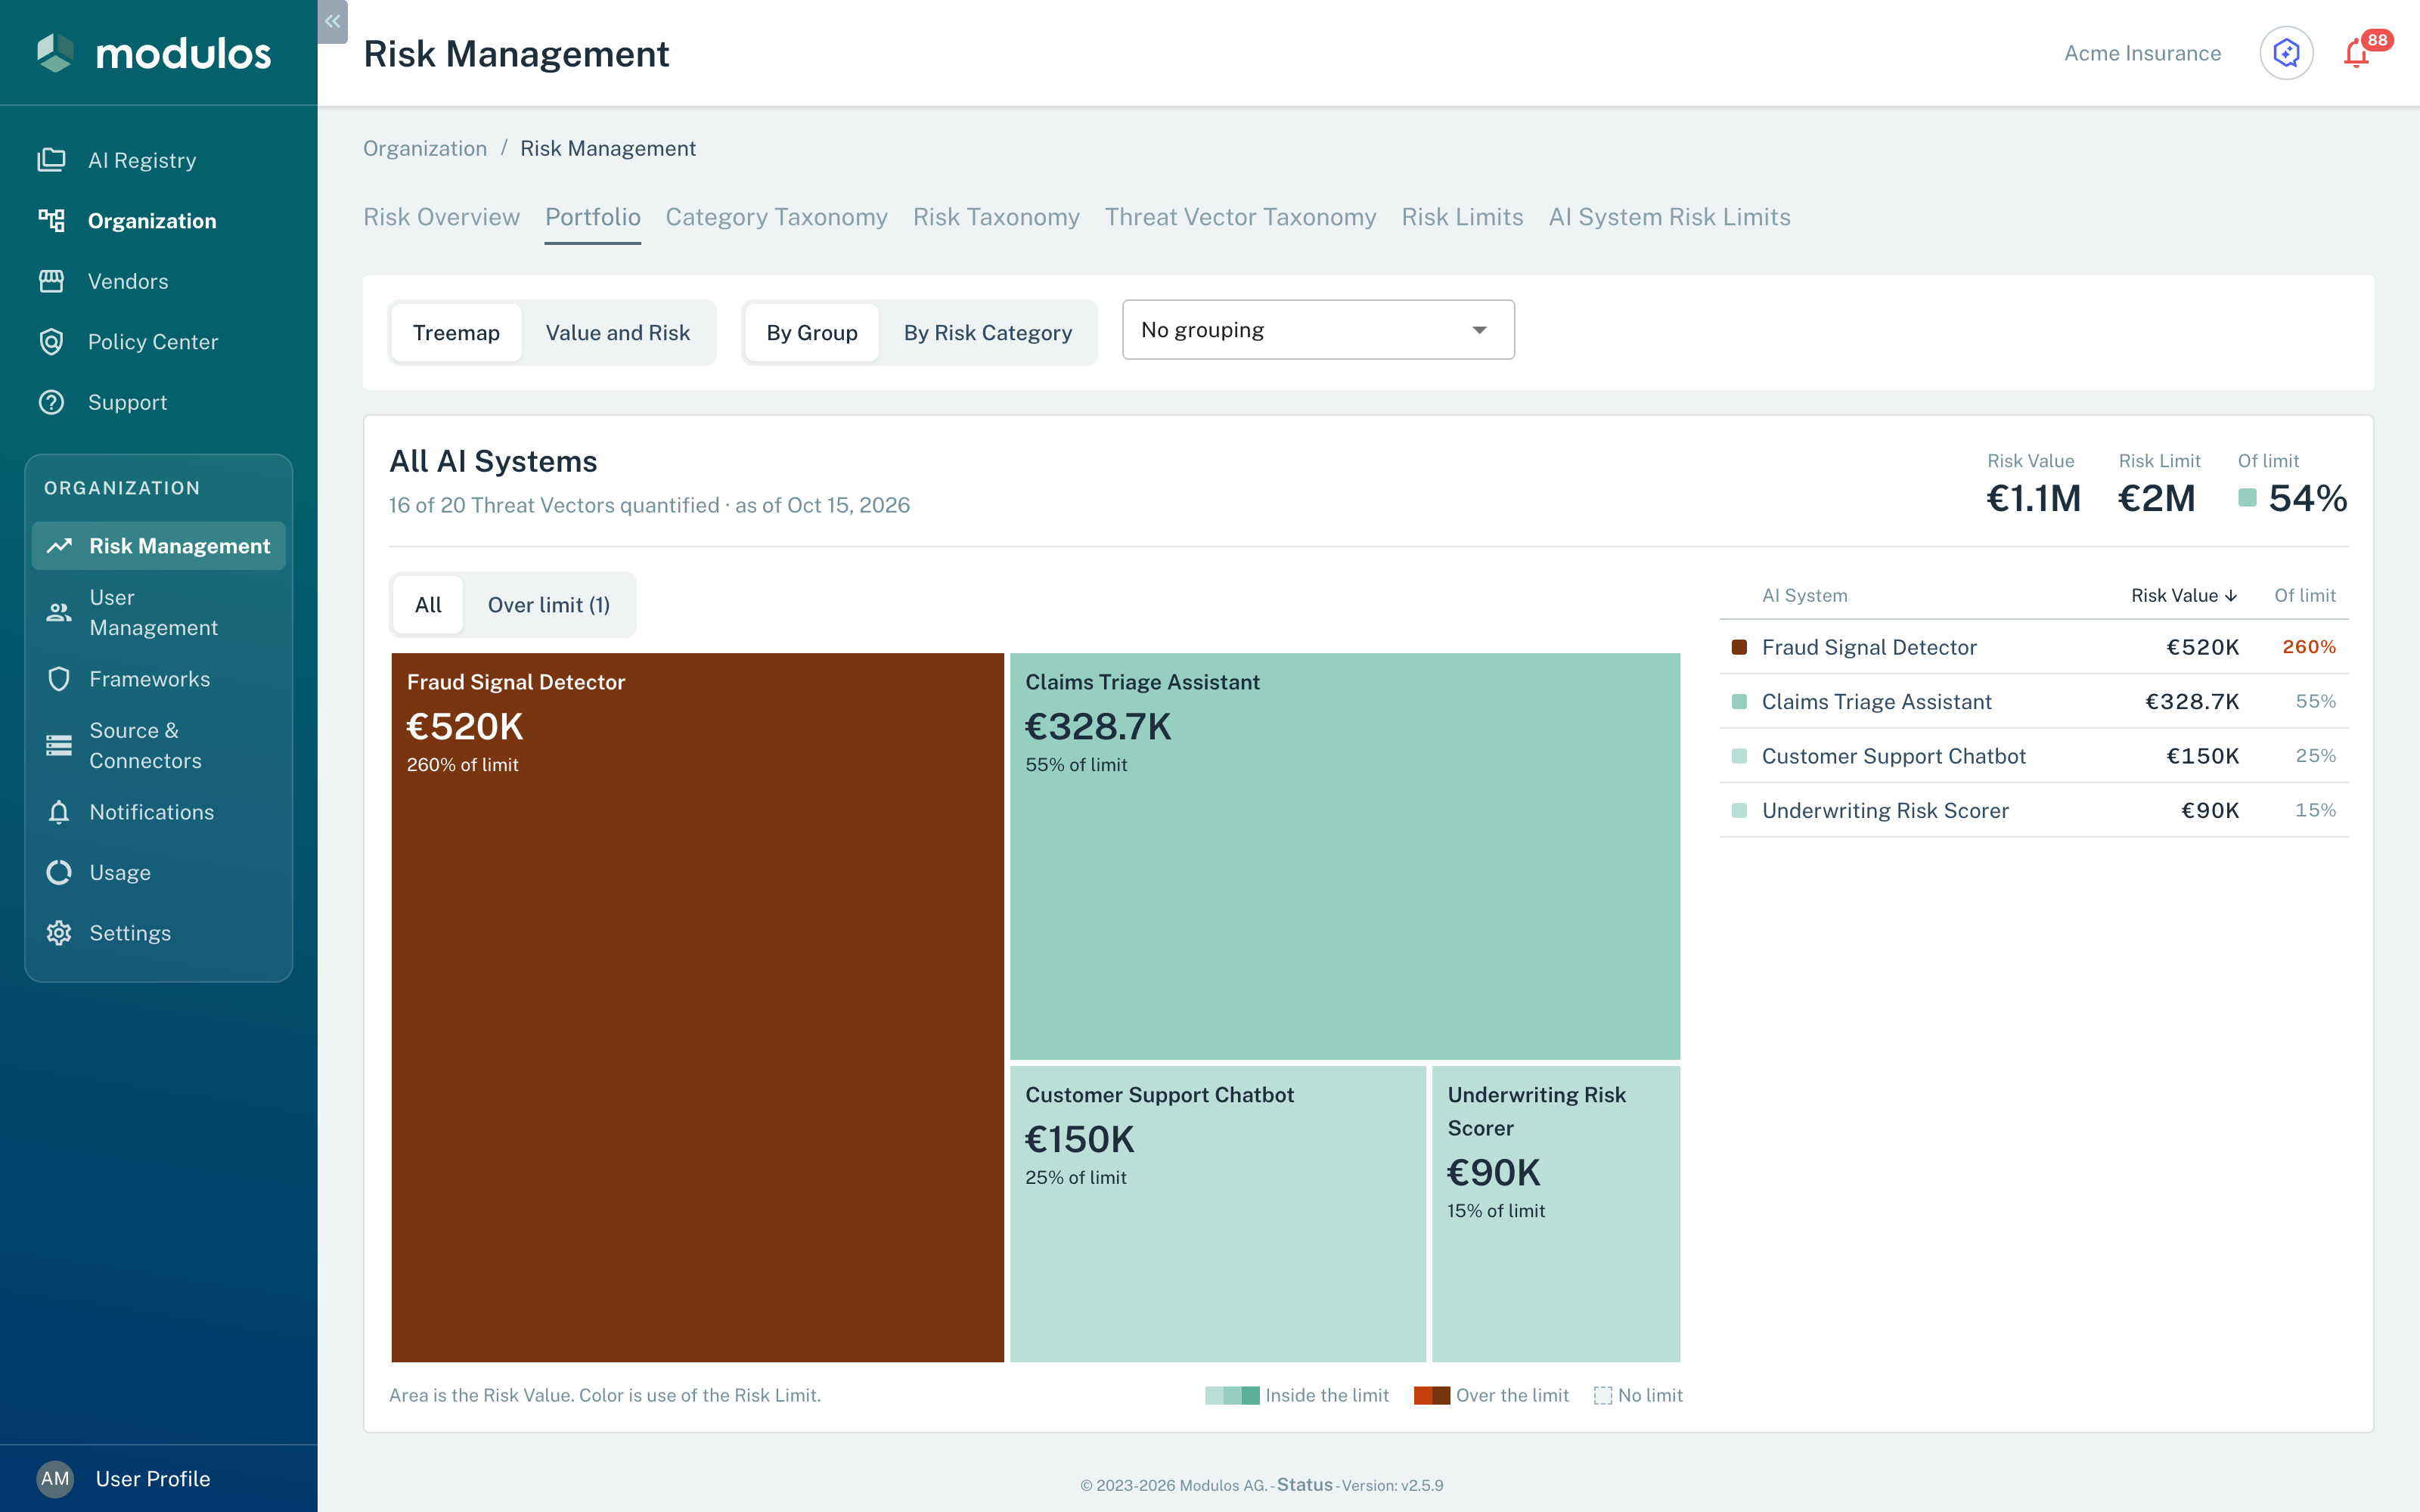
- 1By GroupShows the levels group, AI System, risk, and threat vector.
- 2Over the limitThe tile color shows that this AI System uses more than its limit.
- 3Over limit (1)Dims the entries that are in their limit.
How to read the map
The area of a tile is its Risk Value. The color of a tile shows the part of its Risk Limit that it uses. The legend shows the colors for Inside the limit, Over the limit, and No limit. Next to the map, a ranked table shows the same entries with Risk Value and Of limit. Entries without a value are in a Not quantified section of the table.
Select a tile or a row to go one level down. Select the arrow next to the title to go one level up.
A tile shows a date when its newest run is more than 14 days older than the date of the level. Small tiles do not show this date. Threat vectors have no limit of their own. Their tiles have no limit color.
Levels
The Treemap view divides the risk values in one of two structures:
- By Group: the levels are group → AI System → risk → threat vector. Group by sets the groups: No grouping, Current State, AI Lifecycle Stage, Run Scope, Geographic Scope, or Owner. With No grouping, the first level shows the AI Systems.
- By Risk Category: the levels are risk category → risk → AI System → threat vector.
An AI System can have more than one Run Scope, Geographic Scope, or Owner. Such an AI System goes into the group for its full combination of values. Each AI System counts one time.
Header of a level
Each level of the Treemap view has a header with these items:
- Risk Value, Risk Limit, and Of limit. Without a limit, the header shows No limit and no Of limit.
- The number of quantified threat vectors and the date of the data.
- On the AI System level of By Group, Open AI System opens the Risks page of the AI System. On the level that shows the threat vectors of one AI System risk, Open Risk opens the page of the risk.
Entries above the limit
A level of the Treemap view can have entries above their limit and other entries with a value in their limit. Then All and Over limit (n) show above the map. Select Over limit (n) to dim the entries that are in their limit.
Threat vector level
The threat vector level of the Treemap view shows the method and the date of the newest run. It shows a status badge only when the status of that run is not Quantified. It also shows the share of the risk value and the Risk Value Over Time chart of the threat. View Threat Vector opens its Threat Quantification Detail page in a new browser tab.
Related pages
Value and Risk
Compare the economic value of each AI System with its risk value
Portfolio Overview
The Risk Overview tab and the rollup of risk values
Risk Operating Model
The roles, the rules for totals, and the risk limits
Acting on Quantified Risk
Compare values with limits, decrease risk through Controls, and quantify again