Appearance
Portfolio Overview
Risk quantification is the backbone of AI governance in Modulos. It turns “what could go wrong” into a monetary decision signal you can prioritize, budget, delegate, and audit.
Continuous risk governance
Quantification is a living process, not a one-time gate.
Identify
Make risks explicit and name them consistently
Quantify
Convert threats into monetary expected loss
Treat
Invest in mitigations with measurable impact
Monitor
Re-quantify as systems and data change
Where in Modulos
Use these views to understand and manage risk exposure:
Organization → Risk Management → Risk Overviewfor portfolio rollups and top risk driversOrganization → Risk Management → Risk LimitsandProject Risk Limitsfor appetite and budgetsProject → Risksto add risks, select threats, and run quantification
For a full operating map and permissions model, see Operating Model.
Permissions
- Organization risk configuration is typically managed by the Organization Risk Manager role.
- Quantification runs are typically started by the Project Owner role.
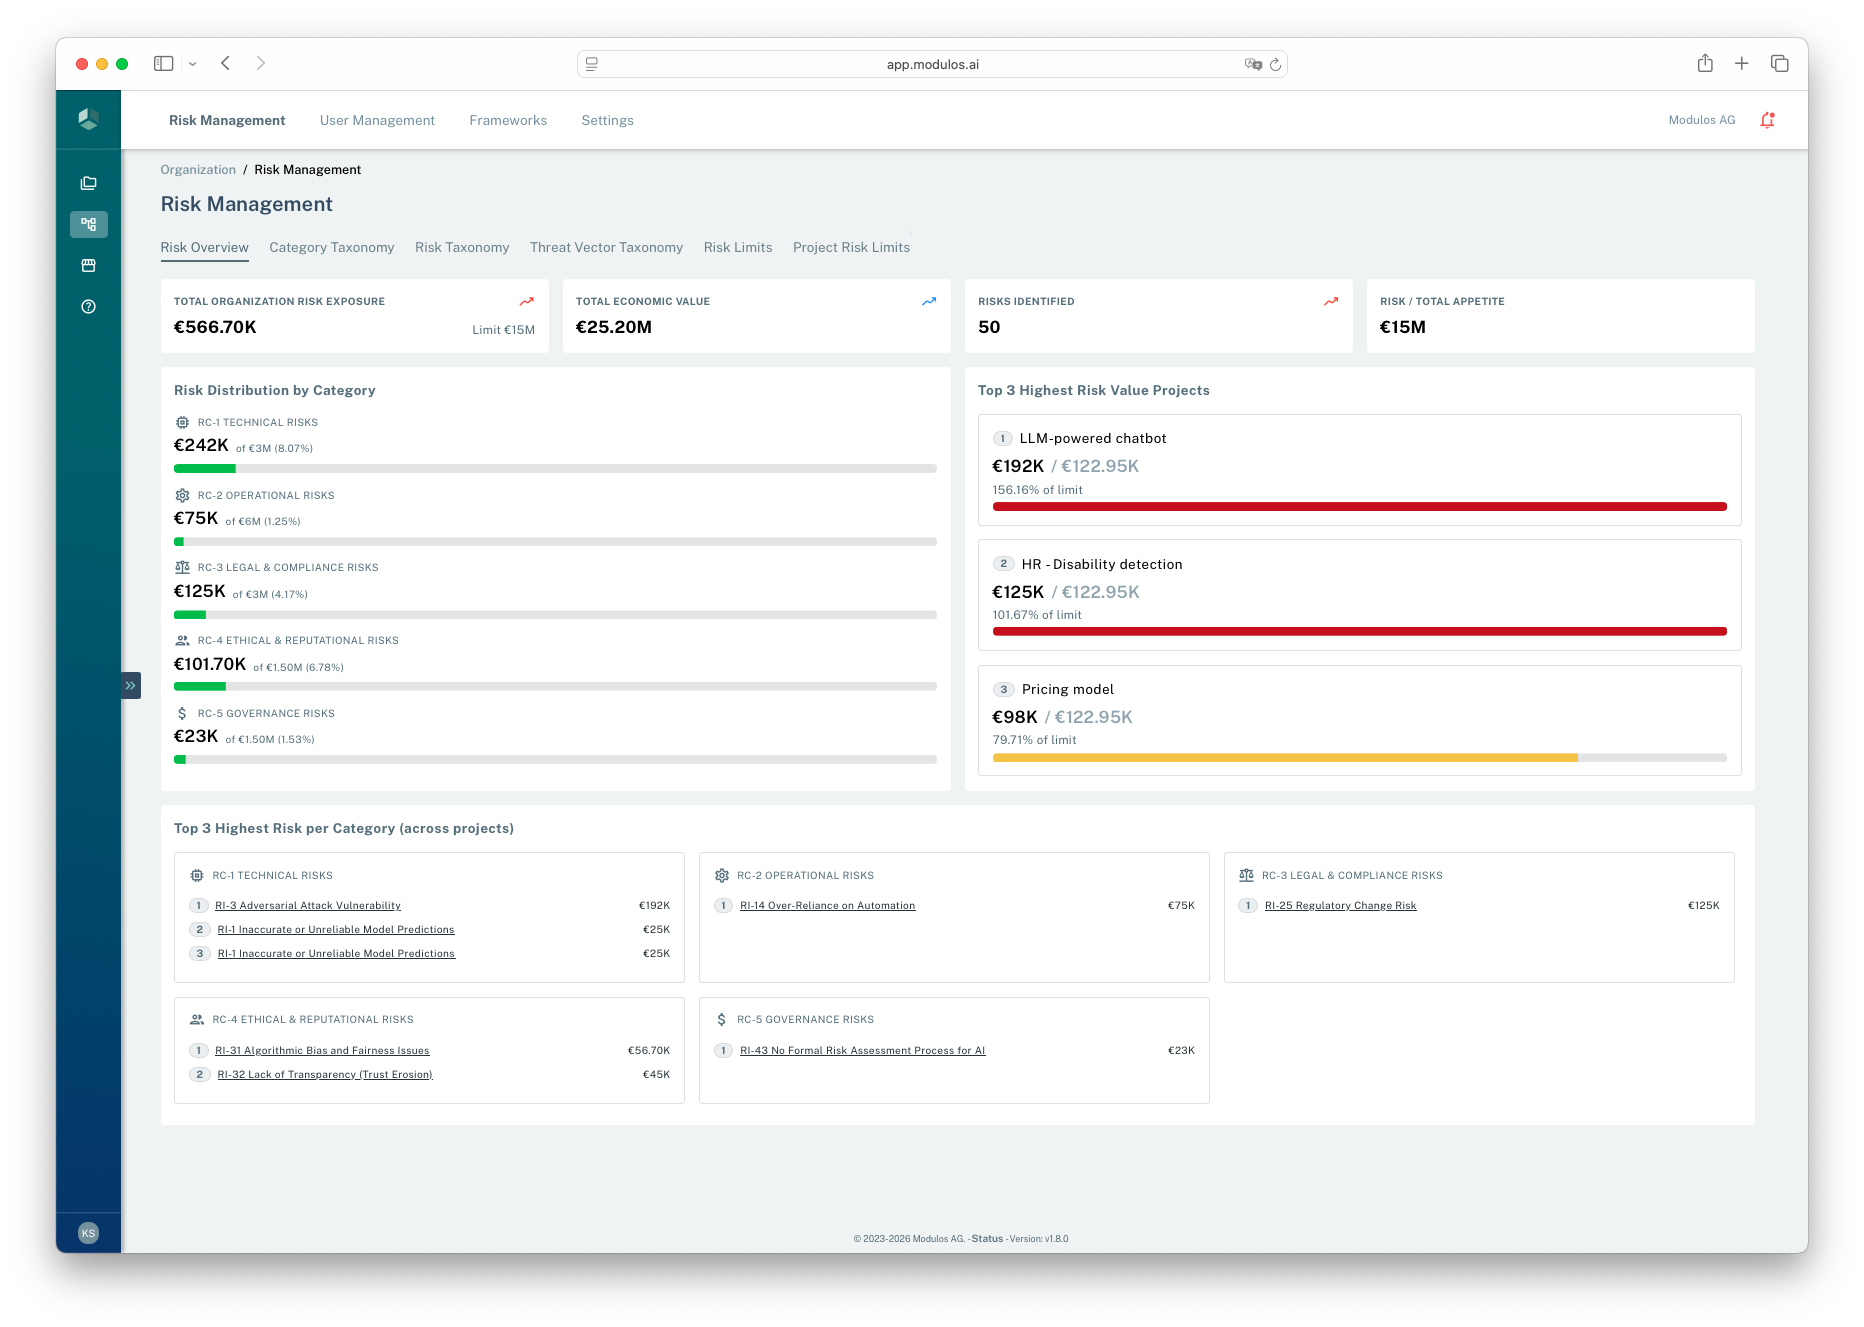
- 1Where you areOrganization-level Risk Management gives you a portfolio view.
- 2Exposure summaryMonitor total exposure and how it compares to appetite.
- 3Top driversIdentify which projects contribute the most to portfolio exposure.
What this is
Risk quantification is not risk avoidance. It makes risk explicit so leaders can decide what to accept, what to treat, and what to stop.
When risk stays qualitative, governance often becomes a veto without substance. When risk is monetary, it becomes a decision conversation: expected loss, risk appetite, and the cost of mitigation.
Quantification also enables speed:
- stage-gate decisions become explicit and repeatable
- teams can delegate decisions within defined risk thresholds
- “too risky” becomes a hypothesis you can challenge and refine
How it works
In Modulos, risks roll up from threats:
text
Expected loss = Σ (rate × damage)- Rate: how often the threat becomes an incident.
- Damage: the monetary loss per incident.
This decomposition is the point. It tells you where risk comes from and what mitigations should target.
Platform objects and rollups
- Organization taxonomy: shared categories, reusable risks, reusable threat vectors.
- Project risks: taxonomy risks selected into a project scope.
- Risk threats: project-specific instances of threat vectors.
- Quantification runs: method, inputs, outputs, status, and one monetary value per threat.
- Rollups and limits: threat → risk → project → category → organization.
Organization
Categories
Risks
Threat vectors
Project
Project risks
Risk threatsinstances of threat vectors
Quantification
Quantification runsstatus + inputs
Rollups and limitsthreat → risk → project → category → organization
Quantification happens at the threat level.
Only quantified threats contribute to totals.
Limits apply at every layer: risk, project, category, organization.
Risk appetite and limits
Quantification becomes actionable when it’s connected to appetite and delegation.
In the current platform model:
- organizations set a total monetary risk appetite
- categories define percentage shares of that appetite and must sum to 100%
- projects have risk limits that must sum to the organization appetite
- within each project category budget, individual risk limits must add up consistently
Organization
€15MRisk Appetite
Categories
20%
3M
Technical Risks
40%
6M
Operational Risks
20%
3M
Legal & Compliance Risks
10%
1.5M
Ethical & Reputational Risks
10%
1.5M
Governance Risks
Projects
Example: Operational Risks
2.4M
LLM-powered chatbot
2.0M
HR - Disability detection
1.6M
Pricing model
Project Risks
Example: LLM-powered chatbot
900K
Human-AI Interaction Failure
700K
Insufficient Testing and Validation
800K
Lack of Transparency
If limits do not add up consistently, Modulos surfaces warnings and blocks quantification until configuration is corrected.
Portfolio reality
Summing expected loss is a useful starting point. In real organizations, risks can be correlated through shared vendors, shared foundation models, and shared infrastructure. Use scenario analysis and dependency awareness for concentrated exposures.
How to use this
1
Set appetite
Define a total risk budget and category shares
2
Adopt the taxonomy
Start with the default library and add domain gaps
3
Quantify the top threats
Pick 1–3 threats per key risk and estimate expected loss
4
Treat and re-quantify
Invest in mitigations, then re-run as systems and data change