Appearance
Project Dashboard
The project dashboard is your operational view of governance progress. It summarizes what is complete, what is in review, and where work is blocked.
What this is
Use the dashboard to answer three questions quickly:
- Are we on track to be audit-ready for this scope
- What is blocking progress right now
- Where is risk concentrated and how does it compare to limits
Where in Modulos
Project → Dashboard
Who can do what
Permissions
- Anyone with access to a project can usually view its dashboard.
- Actions surfaced from the dashboard follow normal project permissions. For example, exporting and changing settings require elevated project rights.
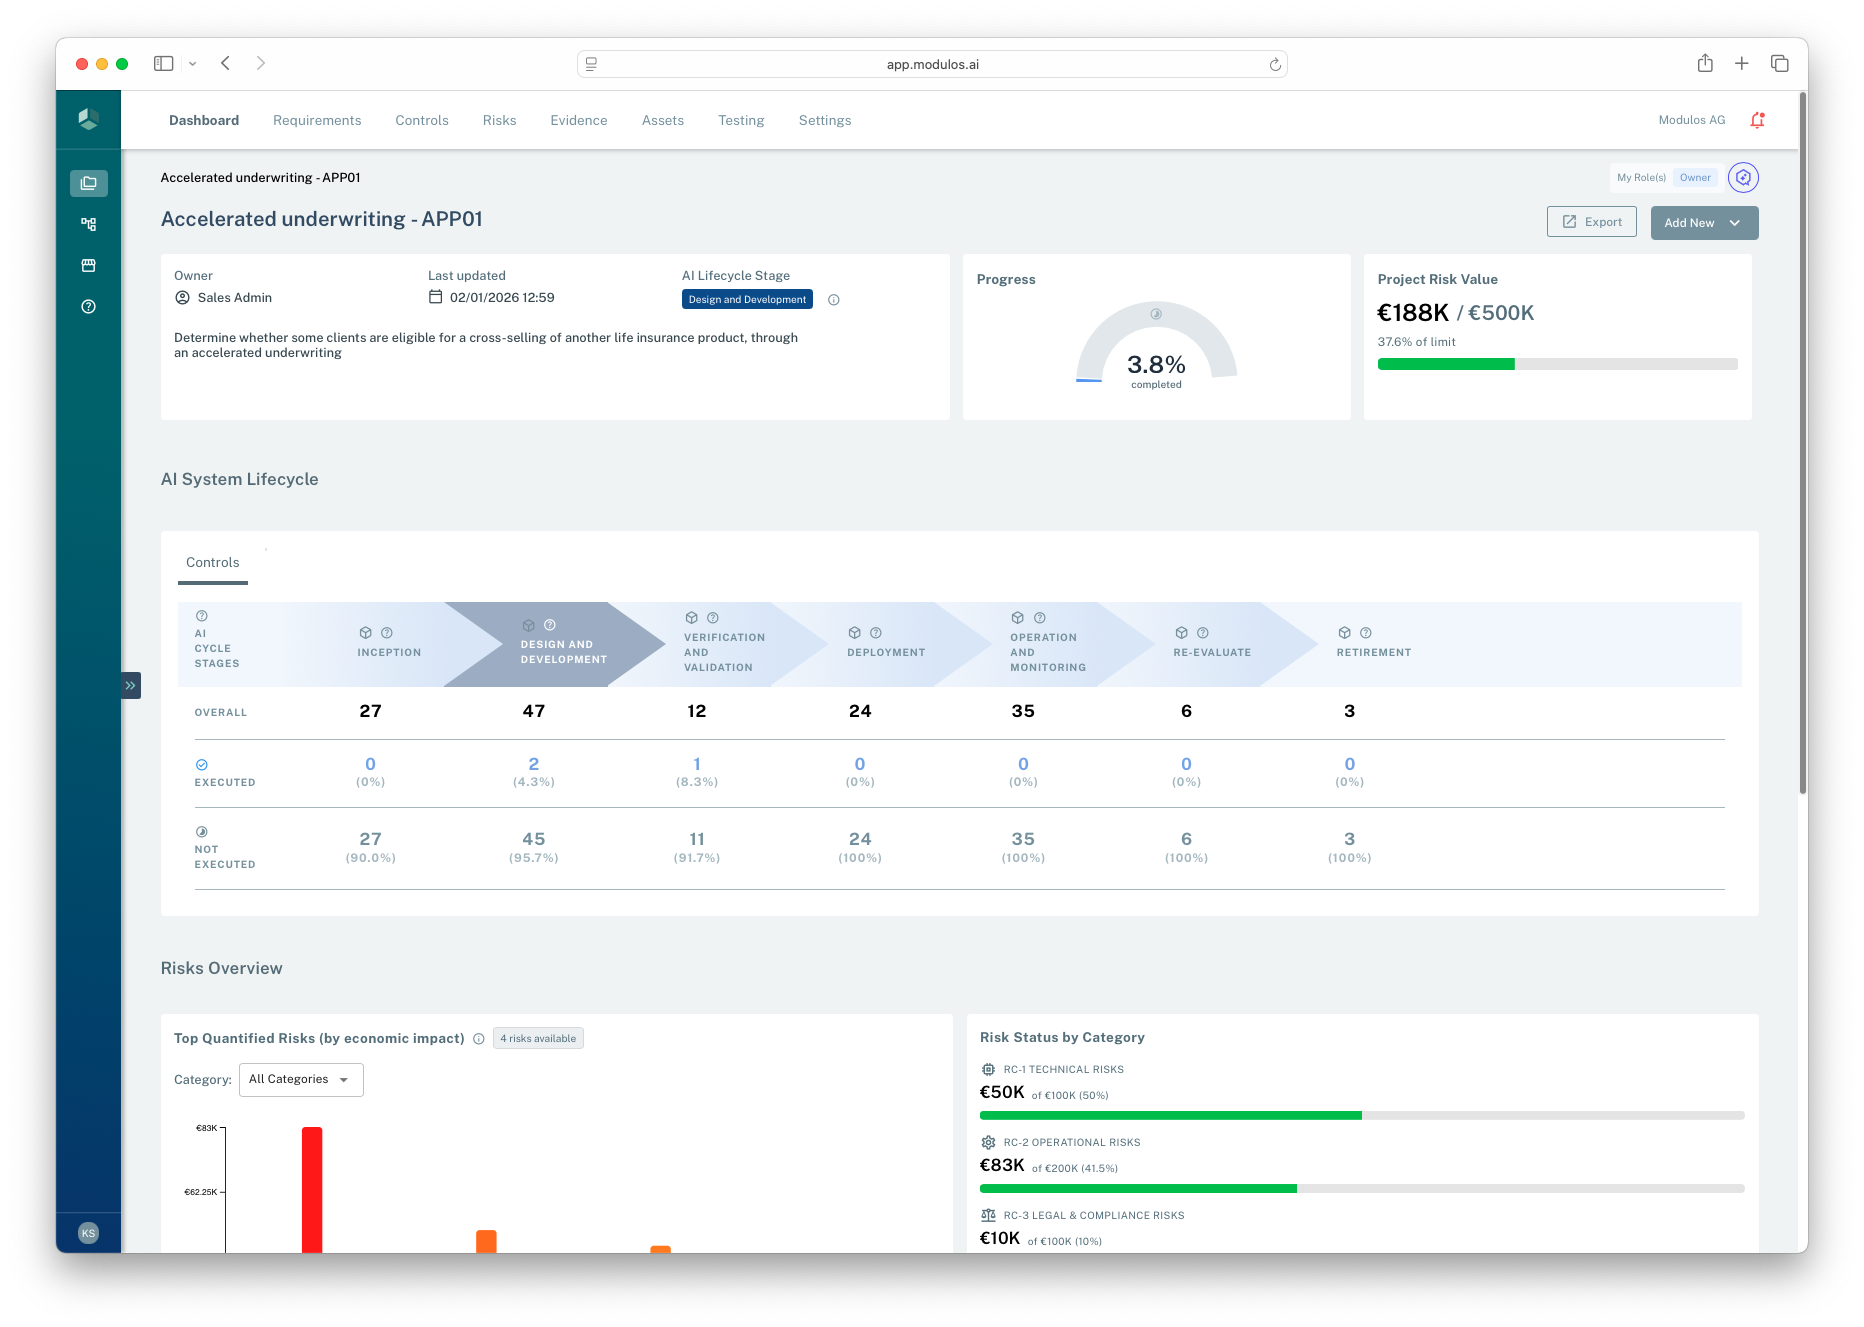
- 1Scope contextProject name, owner, and scope statement anchor the dashboard.
- 2Progress rollupProgress is derived from underlying requirement and control statuses.
- 3Risk signalProject risk value compares quantified exposure to the project limit.
- 4Lifecycle viewFor AI system projects, lifecycle stage segments reporting and control coverage.
How it works
The dashboard is a rollup across project work items.
Governance progress
When governance is in use, the dashboard summarizes:
- overall progress based on control and requirement statuses
- what is waiting on review versus what is still being implemented
- framework coverage and the distribution of work across frameworks
AI lifecycle stage
For AI system projects, the dashboard shows the selected AI lifecycle stage. This is a lightweight way to segment work and reporting by lifecycle phase.
Organization projects typically do not use AI lifecycle stages.
Risk signals
When risk quantification is in use, the dashboard surfaces:
- top quantified risks by economic impact
- risk status by category
- utilization against the project’s risk limits
This is a decision signal. The durable audit trail lives on the underlying objects and their Comments and Logs.
Rollups and signals on the dashboard
Governance rollups
Controls
Not executedExecuted
Requirements
Not fulfilledFulfilled
Frameworks
Project progress
Risk decision signals
Risks
Threat vectors
Quantification runs
Project risk value and limits
Decision signal
Audit-ready execution
- traceable status changes
- evidence attached
- decisions documented
Dashboards are summaries. The audit trail lives in the underlying objects, evidence, and review decisions.
How to use it
1
Start with the scope
Confirm the project description still matches what is being governed
2
Check what is blocked
Look for items in review or missing evidence that prevent completion
3
Prioritize the top gaps
Focus on the controls and requirements that drive the most work remaining
4
Use risk as a decision signal
Quantify and monitor the most important threats and compare to limits
5
Drill into the audit trail
Open the underlying objects to see rationale, evidence, and logs
Important considerations
- Dashboards summarize. Decisions should still be traceable through evidence, reviews, and object logs.
- If the dashboard looks incomplete, it may reflect missing scope, missing frameworks, or missing permissions.
- Treat the AI lifecycle stage as a reporting aid, not as a compliance gate.