Appearance
Risk Quantification
Risk quantification turns risk statements into monetary outputs so you can prioritize treatment and investment.
Modulos treats “quantified” as a concrete numeric value. A 5×5 risk matrix is not quantification and is often misleading for prioritization.
Qualitative label
"This is high risk."
Hard to compare, budget, and delegate
€ 2.4MExpected annual loss
"Now you can prioritize treatment and investment."
Where in Modulos
Quantification is performed at the risk threat level in projects:
Project → Risks → select a risk → select a threat → Quantify
Quantification depends on organization-level budget configuration:
Organization → Risk Management → Risk LimitsOrganization → Risk Management → Project Risk Limits
For the end-to-end operating model, see Operating Model.
Permissions
Starting quantification runs requires the Project Owner role. Other project roles can typically view quantified results for review and audit.
How it works
Why not risk matrices
Qualitative matrices tend to fail in the places leaders care about:
- they don’t force decomposition, so they don’t show what mitigations should target
- they don’t support rational comparison across risks, projects, or time
- they create false confidence through color and category labels
Why money
Money is the point because it:
- serves as a universal unit across risk types
- forces abstract harms (reputation, trust, mission delay) into stakeholder-relevant terms
- connects directly to organizational risk appetite, which is ultimately expressed through resource allocation
The core model
Quantification works best when it forces decomposition.
A useful mental model is expected loss:
text
Expected loss = Σ (rate × damage)- Rate: how often the threat becomes an incident (per period or per unit of activity).
- Damage: the monetary loss per incident, including direct, indirect, and strategic costs.
Even rough, assumption-driven estimates are usually more useful than qualitative labels, because assumptions can be challenged and improved.
1
Define the threat
One pathway with a clear loss mechanism
2
Estimate rate
How often it becomes an incident, with an explicit denominator
3
Estimate damage
Direct, indirect, and strategic costs per incident
4
Compute expected loss
Produce a monetary value you can compare and budget
Estimating rate
Rate estimation is easiest when you force explicit structure.
A practical approach is a Fermi-style decomposition. The point is not precision, it is explicit assumptions you can challenge and improve.
text
Incidents/year = decisions/year × failure probability/decision × escalation fraction
Expected loss/year = incidents/year × loss/incident
Best practices:
- pick a denominator you can defend, such as per deployment-year, per user-hour, or per 10,000 requests
- use telemetry and incident history when you have it, and analogies when you do not
- write assumptions down so they can be challenged and improved
A useful property of numbers
A wrong number can start a productive argument. “Your estimate assumes 10,000 requests per year, but telemetry shows 150,000” improves the model. “I disagree this is high risk” usually does not.
Estimating damage
Damage per incident is often a mix of:
- direct cost: remediation, refunds, compensation, legal and regulatory cost
- indirect cost: operational disruption, workarounds, engineering time, lost deals
- strategic cost: reputation and trust impact, market access, future constraints
Some harms are hard to price, not impossible. Use proxies that leadership recognizes: revenue impact, churn, legal cost, remediation cost, or opportunity cost of delay.
How quantification works in the platform
In Modulos, quantification is performed at the risk threat level:
- a project risk has one or more risk threats, each referencing a taxonomy threat vector
- each risk threat can have one or more quantification runs
- each run records inputs, outputs, a status, and a single monetary value
Risk totals can then be rolled up as the sum of quantified risk threats.
Risk
Model bias risk
Risk threats
Demographic bias
Training data drift
Output inconsistency
Quantification runs
Run 1quantified
Run 2in progress
Run 3failed
Monetary rollups
€ 1.2Mexpected annual loss
Only quantified contributes
How to run quantification
In the UI, quantification is a short workflow:
- start from a project risk and select a threat
- choose a method
- configure parameters
- start the run and return to the risk detail page
Runs execute asynchronously. The threat status updates from “in progress” to “quantified” when results are ready.
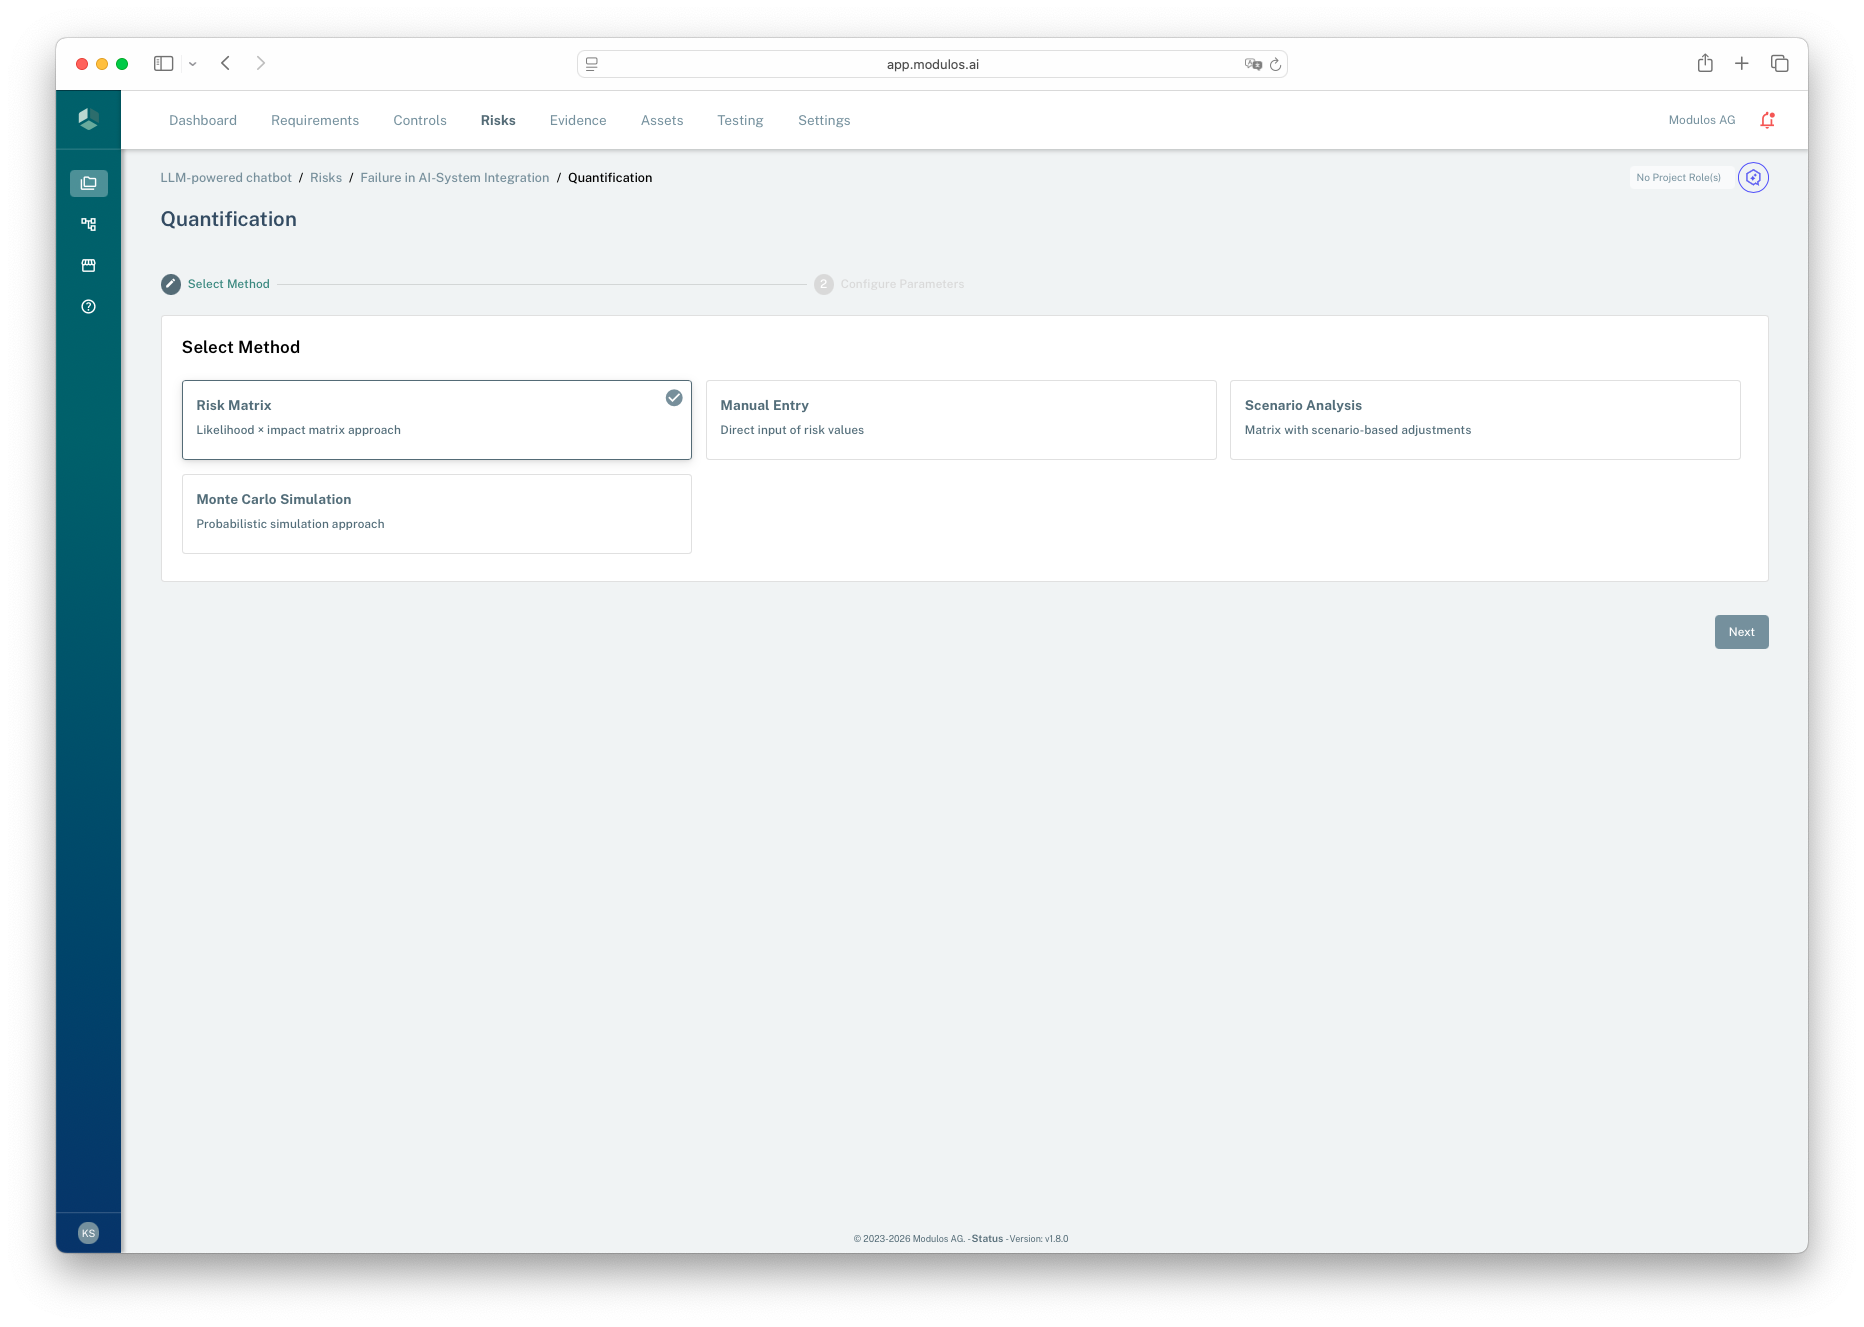
- 1Wizard contextQuantification is a short two-step workflow.
- 2Method selectionChoose the simplest method you can defend with available data.
- 3Proceed to parametersConfigure inputs before starting an asynchronous run.
Choosing a method
The platform supports multiple quantification methods:
- Manual entry: use when you already have a defensible monetary estimate.
- Scenario analysis: use to structure assumptions and ranges with transparent logic.
- Monte Carlo frequency and severity: use when you want a probabilistic model and can justify input distributions.
If you see a risk-matrix style input, treat it as temporary scaffolding. It produces a number, but it’s easy to confuse “score” with “estimate” unless you calibrate it against incident data.
Start simple, then add rigor
Complex models do not fix weak inputs. If you lack incident data, start with scenario analysis and explicit assumptions. Introduce Monte Carlo when you can justify distributions and explain them to stakeholders.
What Modulos stores
Each quantification run records:
- the selected method
- structured input parameters and output values
- a status
- a single monetary value used for rollups
Only a run with status “quantified” contributes value to risk totals. This keeps dashboards from treating incomplete work as a final estimate.
Calibration and review
Quantification must be treated as a continuous loop:
- track incidents and near-misses from day one
- periodically compare estimates to realized outcomes
- update assumptions, taxonomy, and methods as reality changes
Without feedback loops, numbers degrade into pseudo-precision.
When quantification fails
Quantification can be systematically wrong when analogies break, experts share the same bias, or the domain is genuinely novel. The corrective is calibration: compare past estimates to realized outcomes and adjust your assumptions and taxonomy.
Guardrails and prerequisites
Quantification relies on consistent risk limits and appetite configuration. If the underlying limits are inconsistent, Modulos will block quantification until the configuration is corrected.
In practice, this means:
- category limits should sum to 100% of total organization risk appetite
- the sum of all project risk limits should match total organization risk appetite
- within a category, the sum of individual risk limits should match the project’s category risk limit
Using risk limits
Treat limits as budgets for exposure:
- Below limit: accept or delegate the decision within guardrails
- Near limit: review assumptions and prioritize mitigation
- Above limit: mitigate, transfer, avoid, or change scope