Appearance
Compliance Graph
The compliance graph is an interactive visualization that shows how frameworks, requirements, and controls relate to each other. It turns the flat tables into a navigable map so you can see structure, spot gaps, and understand coverage at a glance.
What this is
The graph renders your project's governance objects as connected nodes:
- Framework nodes represent the regulatory frameworks in scope
- Requirement nodes show the obligations derived from those frameworks
- Control nodes show the measures that implement those obligations
Edges connect parent to child: frameworks contain requirements, requirements link to controls. The result is a hierarchical map of your compliance posture that you can filter, search, and navigate.
Where in Modulos
Project → Graph
Who can do what
Permissions
- Anyone with access to a project can view the graph.
- The graph is read-only. To change statuses or edit objects, click a node to navigate to its detail page.
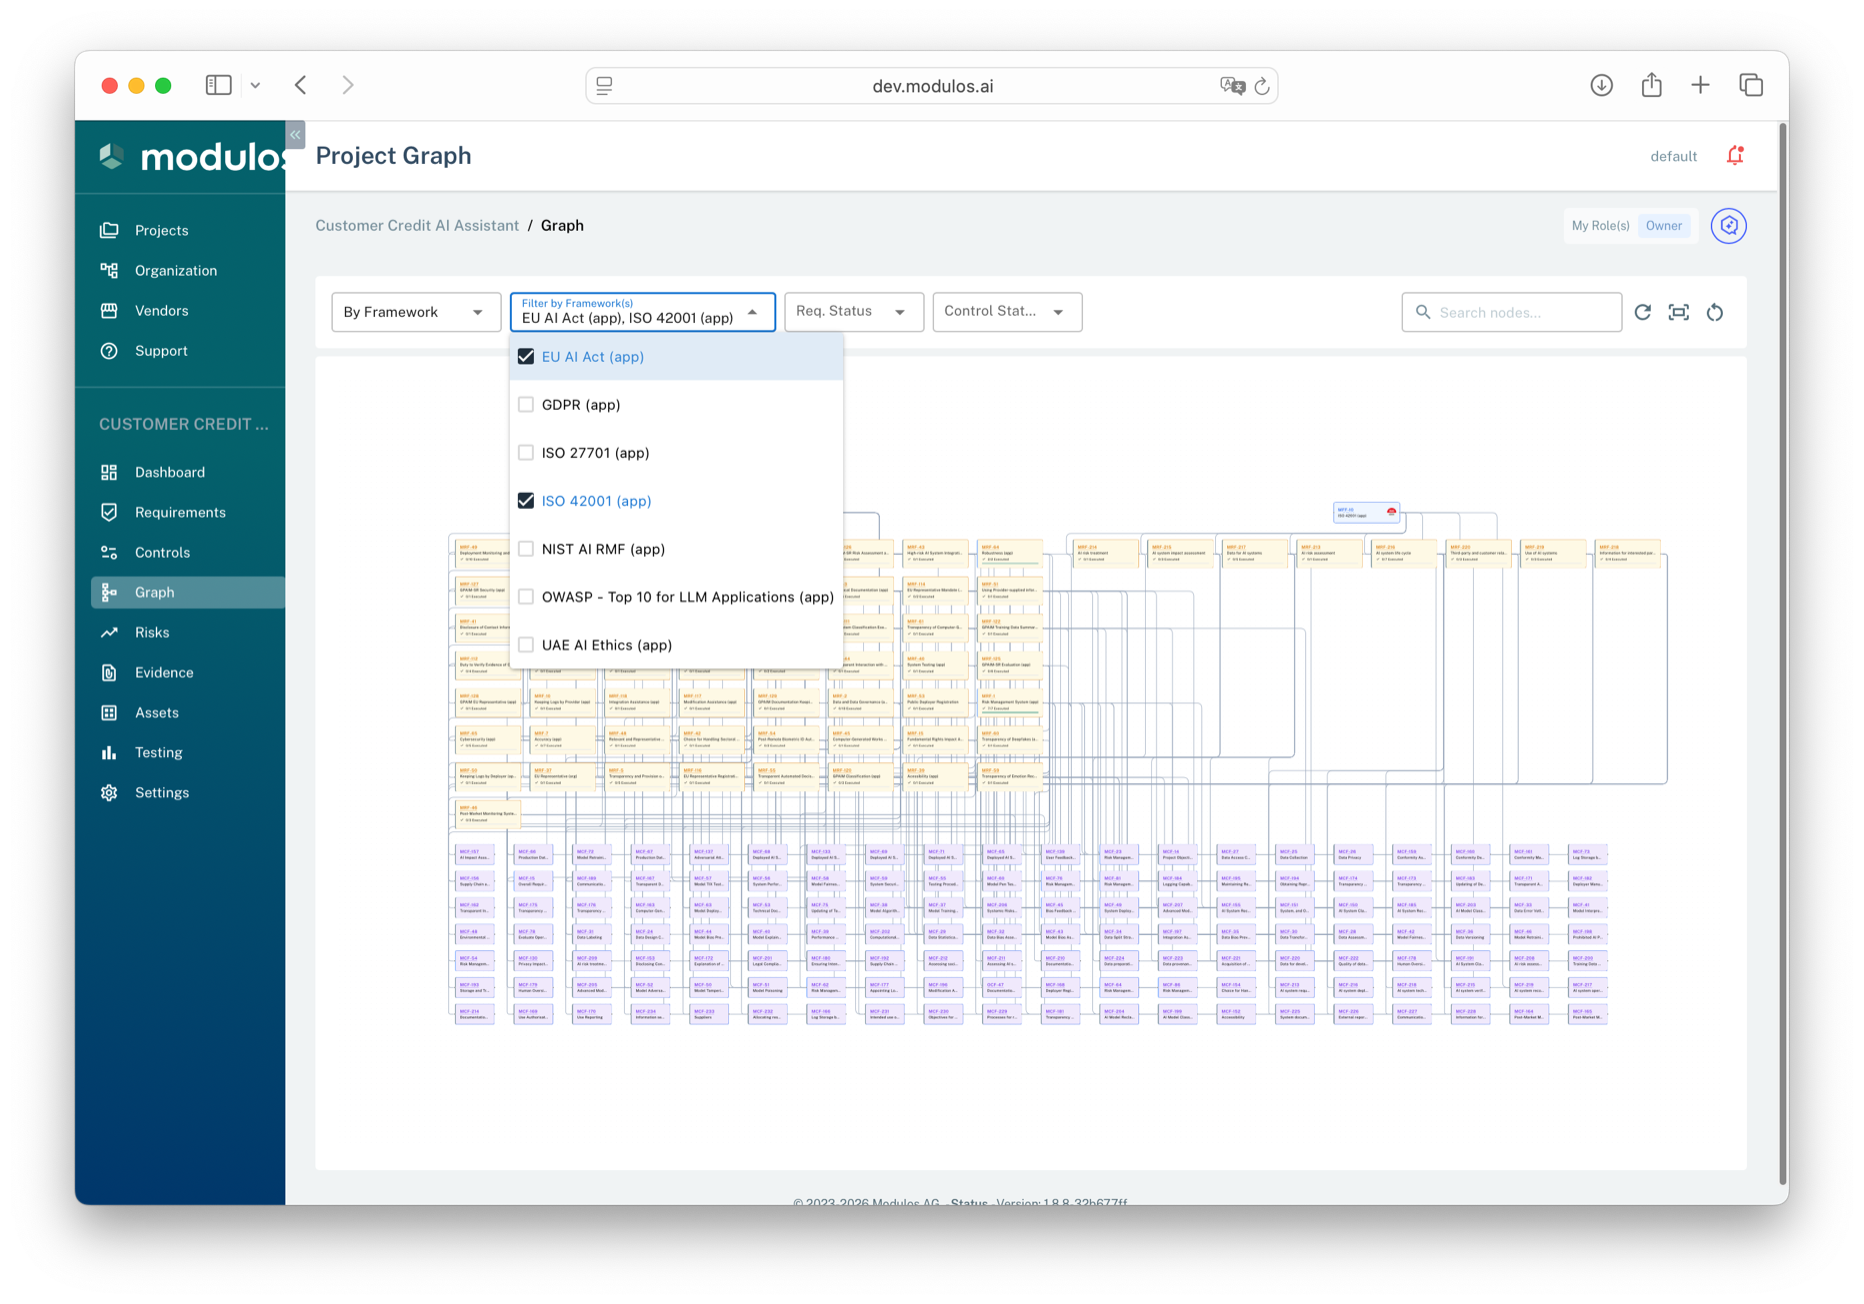
- 1Strategy selectorChoose between Framework, Lifecycle, or Tag views to change how nodes are grouped.
- 2Status filtersFilter by requirement status or control status. Cascading logic hides orphaned parent and child nodes.
- 3Framework filterSelect which frameworks to display. The dropdown shows all frameworks in the project scope.
- 4Requirement nodesShow fulfillment status as a colored left border and an execution progress bar for linked controls.
- 5Control nodesShow execution status as a colored left border. Click the code to open the control detail.
How it works
Strategy views
The graph supports three strategy views that determine how nodes are grouped:
| Strategy | Groups by | Use case |
|---|---|---|
| Framework | Framework → Requirements → Controls | See coverage per regulation |
| Lifecycle | AI lifecycle stage → Controls | See work distribution across lifecycle phases |
| Tag | Tag → Controls | See controls grouped by custom tags |
Select a strategy from the dropdown in the toolbar. Your selection is persisted across sessions.
Node status indicators
Nodes display their current status through a colored left border:
- Requirements show fulfillment status (fulfilled, not fulfilled, out of scope)
- Controls show execution status (executed, not executed, out of scope)
Requirement nodes also show an execution progress bar: a ratio of how many linked controls are executed out of the total.
Framework node icons
In the Framework strategy, framework nodes display the framework icon (or country flag) alongside the framework code for quick visual identification.
Filtering
The toolbar provides filters that narrow the visible nodes:
- Framework filter (Framework strategy) — show only selected frameworks
- Lifecycle filter (Lifecycle strategy) — show only selected lifecycle stages
- Tag filter (Tag strategy) — show only selected tags
- Requirement status filter (Framework strategy) — show only requirements with selected statuses
- Control status filter (all strategies) — show only controls with selected statuses
Status filters cascade: filtering controls removes requirements that have no surviving children, and vice versa. Parent nodes (frameworks, tags) with no surviving children are also hidden.
All filter selections are persisted to your browser so they survive page reloads.
Search
Use the search field to find nodes by code or name. Matching nodes are highlighted; non-matching nodes are dimmed.
Navigation
Click any node's code to navigate directly to its detail page (requirement or control). This is the bridge between the visual overview and the working detail views.
How to use it
1
Pick a strategy
Choose Framework to see regulatory coverage, Lifecycle to see phase distribution, or Tag for custom groupings
2
Filter to focus
Use framework, status, or tag filters to narrow the view to what matters right now
3
Spot the gaps
Look for requirements with low execution ratios or clusters of not-executed controls
4
Click through to act
Click a node code to open its detail page and take action
Important considerations
- The graph is a navigation and orientation tool, not an editing surface. All changes happen on the detail pages.
- Status filters cascade. Filtering by control status can hide requirements, and filtering by requirement status can hide controls. This is intentional: it keeps the view consistent.
- Filter and strategy selections persist per project in your browser's local storage.